
Break-even
See the sales that cover all your costs, how far your sales are above or below them, and which costs move with sales.
Break-even shows how much you need to sell to cover every cost, from your own books. It splits your costs into those that grow with sales and those that don't, and compares your sales with the point where they are all covered.
Open Break-even. It needs a plan that includes insights.
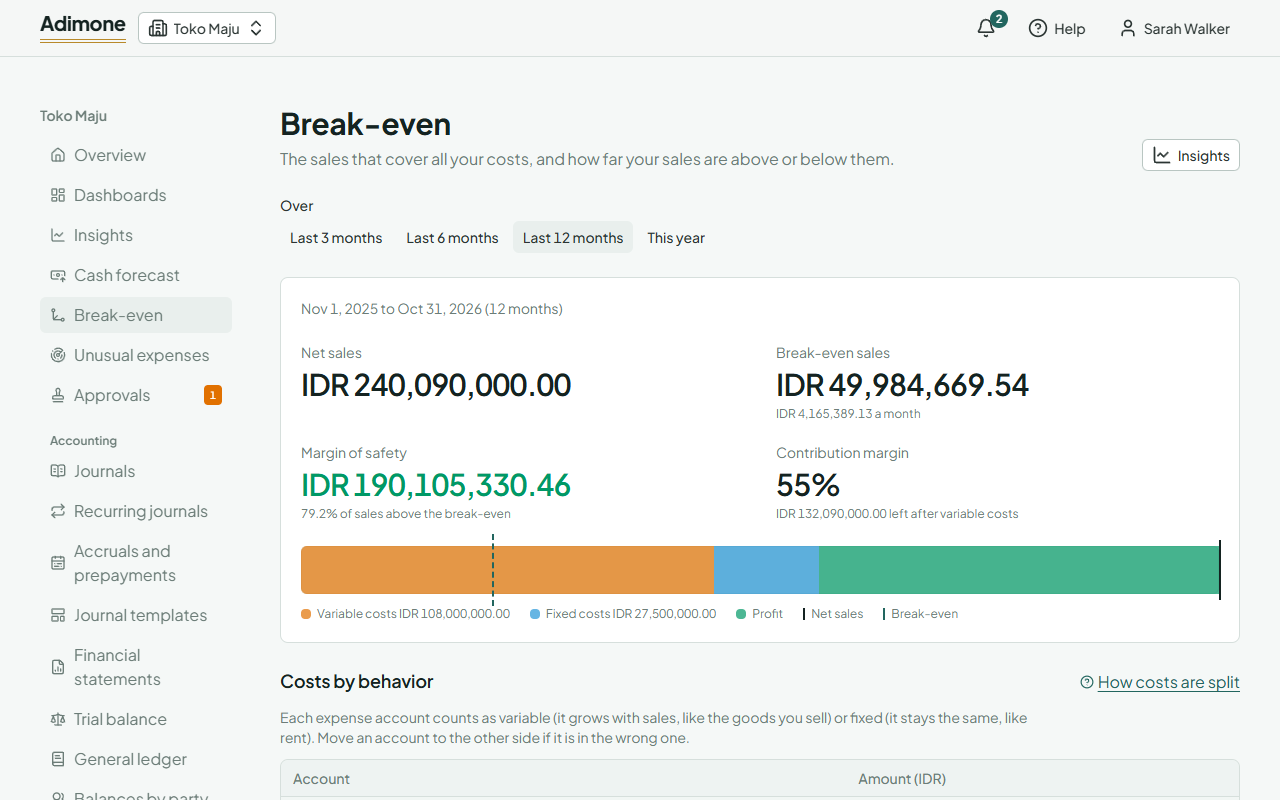
Read the break-even
Under Over, choose the last 3, 6 or 12 whole months, or This year (the whole months so far). At the top you see:
- Net sales: your sales less returns. Other income, such as interest received, is left out.
- Break-even sales: the sales that would just cover your costs over those months, and the same for one month.
- Margin of safety: how far your sales are above the break-even, in money and as a share of sales. In red when sales fall short.
- Contribution margin: what is left of each sale after its variable costs, which goes towards the fixed costs and then profit.
The line below draws it: variable costs first, then fixed costs, then the profit if there is any. The solid mark is where your sales end; the dashed mark is the break-even. When the costs run past the solid mark, the business made a loss.
When variable costs take all of the sales, no amount of sales breaks even: the page says so, and the contribution margin is negative. Check that the costs below are on the right side.
Fixed and variable costs
Every expense account counts as one or the other:
- Variable costs grow with sales, such as the goods you sell, packaging or sales commissions. Cost of sales accounts are variable unless you say otherwise.
- Fixed costs stay about the same whatever you sell, such as rent, salaries or subscriptions. Other expense accounts are fixed unless you say otherwise.
Income tax is left out.
The table under the line lists the expense accounts that moved in those months, by side. If one is on the wrong side, choose Count as variable or Count as fixed on its row (this needs permission to manage the chart of accounts). The figures are worked out again straight away. You can also set Cost behavior when you open the account in the chart of accounts.
How it is worked out
- Contribution margin = (net sales − variable costs) ÷ net sales.
- Break-even sales = fixed costs ÷ contribution margin.
- Margin of safety = net sales − break-even sales.
The figures are only as good as the split between fixed and variable costs; most costs are a bit of both, so read the break-even as a guide.